Umbrella Sampling - Incomplete WHAM Analysis

GROMACS version: 2021.4/gpuvolta
GROMACS modification: Yes/No
Dear all,

I am new to GROMACS and I’m encountering problems with Umbrella Sampling. I was able to generate a topology, define a unit cell, solvate and add ions, minimise and energy equilibrate, generate configurations and perform umbrella sampling. However, WHAM analysis of the PMF (Picture 1) spans ~ 0.7-0.8 nm, which is very different to the Tutorial 3 diagram (spans from 0.5-5 nm). The umbrella*.tpr and umbrella*_pullf.xvg files were concatenated to tpr-files.dat and pullf-files.dat, respectively, the WHAM analysis. Not sure if I’m missing something super obvious but I’ve got no idea how to fix this, and would appreciate any help, thanks!

^ Picture 1

Are you trying to complete the tutorial or work with a different system? If the latter, you certainly will have to change the relevant .mdp settings that define the reaction coordinate. If you can provide more information (nature of the system, what you’re trying to do, relevant .mdp snippets), we can probably comment better.

Hello!

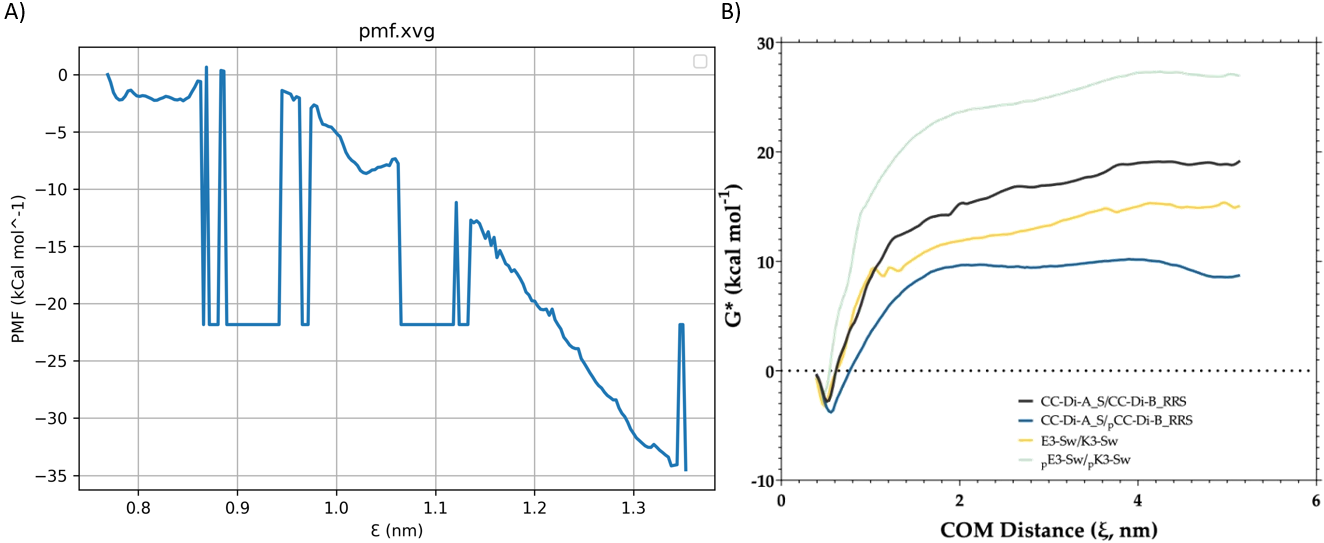
I am using the tutorial as a guide but using a different system. I have two alpha-helix structures each 35 residues in length which I identified as Chain_A and Chain_B. The goal my project is to perform umbrella sampling to determine the potential of mean force (PMF) or free energy (G) in my peptides. To generate the 501 conf*.gro files (; Pull code snippet from md_pull.mdp), I ran the steered MD simulation and extracted the frames.

; Pull code
pull = yes
pull_ncoords = 1 ; Only one reaction coordinate
pull_ngroups = 2 ; Two groups defining one reaction coordinate
pull_group1_name = Chain_A
pull_group2_name = Chain_B
pull_coord1_type = umbrella ; Harmonic potential
pull_coord1_geometry = distance ; Simple distance increase
pull_coord1_dim = N N Y
pull_coord1_groups = 1 2
pull_coord1_start = yes ; Define initial COM distance > 0
pull_coord1_rate = 0.01 ; 0.01 nm per ps = 10 nm per ns
pull_coord1_k = 1000 ; kJ mol^-1 nm^-2

From the tutorial, I used the bash script to create the summary_distances.dat file, however there were no two configuration files with a spacing of 0.2 nm. As per the tutorial, I ran an NPT equilibration (npt_umbrella.mdp snippet below) with commands like:

gmx grompp -f npt_umbrella.mdp -c conf6.gro -p topol.top -r conf6.gro -n index.ndx -o npt0.tpr
gmx mdrun -deffnm npt0

gmx grompp -f npt_umbrella.mdp -c conf486.gro -p topol.top -r conf500.gro -n index.ndx -o npt24.tpr
gmx mdrun -deffnm npt24

; Pull code
pull = yes
pull_ncoords = 1 ; Only one reaction coordinate
pull_ngroups = 2 ; Two groups defining one reaction coordinate
pull_group1_name = Chain_A
pull_group2_name = Chain_B
pull_coord1_type = umbrella ; Harmonic potential
pull_coord1_geometry = distance ; Simple distance increase
pull_coord1_dim = N N Y
pull_coord1_groups = 1 2
pull_coord1_start = yes ; Define initial COM distance > 0
pull_coord1_rate = 0.0 ; Restrain in place
pull_coord1_k = 1000 ; kJ mol^-1 nm^-2

Following this, was the umbrella sampling (md_umbrella.mdp snippet below) with commands like:

gmx grompp -f md_umbrella.mdp -c npt0.gro -t npt0.cpt -p topol.top -r npt0.gro -n index.ndx -o umbrella0.tpr
gmx mdrun -deffnm umbrella0

gmx grompp -f md_umbrella.mdp -c npt24.gro -t npt24.cpt -p topol.top -r npt24.gro -n index.ndx -o umbrella24.tpr
gmx mdrun -deffnm umbrella24

; Pull code
pull = yes
pull_ncoords = 1 ; Only one reaction coordinate
pull_ngroups = 2 ; Two groups defining one reaction coordinate
pull_group1_name = Chain_A
pull_group2_name = Chain_B
pull_coord1_type = umbrella ; Harmonic potential
pull_coord1_geometry = distance ; Simple distance increase
pull_coord1_dim = N N Y
pull_coord1_groups = 1 2
pull_coord1_start = yes ; Define initial COM distance > 0
pull_coord1_rate = 0.0 ; Restraint in place
pull_coord1_k = 1000 ; kJ mol^-1 nm^-2

Lastly, I concatenated the respective files and ran a WHAM analysis:
ls umbrella*.tpr | sort -V > tpr-files.dat
ls umbrella*_pullf.xvg | sort -V > pullf-files.dat
gmx wham -it tpr-files.dat -if pullf-files.dat -o pmf.xvg -hist histogram.xvg -unit kCal

Thanks again for your help, I’ve been stuck for some time now

Pulling only along the z-axis is almost certainly inappropriate for this system. The reaction coordinate here should like be the COM distance between the two peptides in all three dimensions.

Hello!
I updated my .mdp files to pull along the x- y- z-axis (pull-code snippet below). Initially, I ran into an error that implied my pull groups (each whole peptide) were too large for the box and GROMACS wanted a single “reference atom (pbcatom)” in each group to anchor. I resolved this by finding the atom id of the middle residue in each chain and adding it to the md_pull.mdp (shown below).

; Pull code
pull = yes
pull_ncoords = 1 ; Only one reaction coordinate
pull_ngroups = 2 ; Two groups defining one reaction coordinate
pull_group1_name = Chain_A
pull_group2_name = Chain_B
pull_group1_pbcatom = 283
pull_group2_pbcatom = 867
pull_coord1_type = umbrella ; Harmonic potential
pull_coord1_geometry = distance ; Simple distance increase
pull_coord1_dim = Y Y Y
pull_coord1_groups = 1 2
pull_coord1_start = yes ; Define initial COM distance > 0
pull_coord1_rate = 0.01 ; 0.01 nm per ps = 10 nm per ns
pull_coord1_k = 1000 ; kJ mol^-1 nm^-2
pull_pbc_ref_prev_step_com = yes

However, when I re-run the steered MD simulation and attempt to extract the frames with the get_distance.sh script from the tutorial, I encounter a different error:

Invalid command-line options
In command-line option -n
File ‘-’ does not exist or is not accessible.
The following extensions were tried to complete the file name:
.ndx
In command-line option -n
File ‘select’ does not exist or is not accessible.
The following extensions were tried to complete the file name:
.ndx
In command-line option -n
File ‘com of group “Chain_A” plus com of group “Chain_B”’ does not exist
or is not accessible.
The following extensions were tried to complete the file name:
.ndx
In command-line option -n
File ‘-’ does not exist or is not accessible.
The following extensions were tried to complete the file name:
.ndx
In command-line option -n
File ‘oall’ does not exist or is not accessible.
The following extensions were tried to complete the file name:
.ndx
In command-line option -n
File name ‘dist492.xvg’ cannot be used for this option.
Only the following extensions are possible:
.ndx

Here are the groups of my index.ndx:
0 System : 33822 atoms
1 Protein : 1161 atoms
2 Protein-H : 552 atoms
3 C-alpha : 70 atoms
4 Backbone : 210 atoms
5 MainChain : 282 atoms
6 MainChain+Cb : 350 atoms
7 MainChain+H : 356 atoms
8 SideChain : 805 atoms
9 SideChain-H : 270 atoms
10 Prot-Masses : 1161 atoms
11 non-Protein : 32661 atoms
12 Water : 32613 atoms
13 SOL : 32613 atoms
14 non-Water : 1209 atoms
15 Ion : 48 atoms
16 NA : 21 atoms
17 CL : 27 atoms
18 Water_and_ions : 32661 atoms
19 Chain_A : 570 atoms
20 Chain_B : 591 atoms

I’m assuming I need to tailor the get_distance.sh script to suite my system? But I’m not sure how to do that. I appreciate the help!

Thanks

The error messages indicate typographical mistakes in your command line.

Thank you so much for your help, I’ve made it to the last step, the WHAM analysis. Unfortunately, once again, I’ve run into a problem I don’t understand. The WHAM analysis of the PMF (Figure A) is very far off the results I’m attempting to replicate (Figure B - Yellow line). I changed the md_pull.mdp, npt_umbrella.mdp and md_umbrella.mdp to pull along the x- y- z-axis and followed the instructions from the tutorial. After, the umbrella*.tpr and umbrella*_pullf.xvg files were concatenated to tpr-files.dat and pullf-files.dat, respectively and a WHAM analysis was run with:

gmx wham -it tpr-files.dat -if pullf-files.dat -o -hist -unit kCal

Thanks for all your help!

You have several regions of very poor sampling. Inspect the histograms and you will see a lack of overlap. This means your window setup and/or force constants are not optimized.

Hello,

Apologies for the late reply, I’ve been trying different settings in the .mdp files (changing the pull_coord1_rate and pull_coord1_k). I see a difference in the pmf graph, however, nothing that resembles the original graph I’m trying to replicate. Is there another way to find the optimal settings for Umbrella Sampling? Or does it come by brute force of trial and error? Are there other settings I should be changing as well?

Thanks again for your help, seems like I need to optimise my system

If you’re trying to reproduce someone else’s result, follow the exact method they have published. If that doesn’t work or you don’t have enough details, contact the authors for more information.

I’ll get in touch with them and try to replicate the results. Thanks so much for your help over the past few days, I appreciate it.

Hello!
I followed their exact method and I still arrive at the same pmf graph I showed earlier. One difference that was pointed out to me was a difference in software version. The author used 2021.3 and I used 2021.4-gpuvolta. As a research student with deadlines, I have been given access to a supercomputer, hence the “gpuvolta”. Is it better to use the latest GROMACS version (2025.2-gpu) or download and install 2021.3. If the latter, how do I install it as a gpu compatible version? Also, do the .mdp files change between software versions?

Thank you

It is unlikely that a minor software version led to the issue. The difficulty reality is that umbrella sampling results are notoriously difficult to reproduce. Your reaction coordinate has many areas of poor sampling, so either you need to add more windows or adjust the force constants.