GROMACS version: 2022.4
halo everyone
I have equilibrated one window for pulling simulation with reference pressure 1 bar and compressibility 4.5e-5 per bar. After 45 ns run, average pressure is 3.89 bar with rmsd value 244.81. Is it acceptable? Please help.
Pressure fluctuates a lot, especially if your simulation is small. It sounds like it could be acceptable, but just numbers don’t say much.
Is the pressure stable during the simulation? It is often a good idea to discard the beginning of the data. Are the results in the same ballpark if you use -b 5000 with gmx energy?
It looks reasonably stable to me. You will have to decide what is stable enough/acceptable. It might be easier to judge if you use “Data” → “Transformations” → “Running average”, in xmgrace, with a high number, let’s say 10,000. From the Tot-Drift of your numbers, the pressure is probably dropping slightly over the course of the simulation.
If you hide the first data set it will help. And remember to rescale the axes.
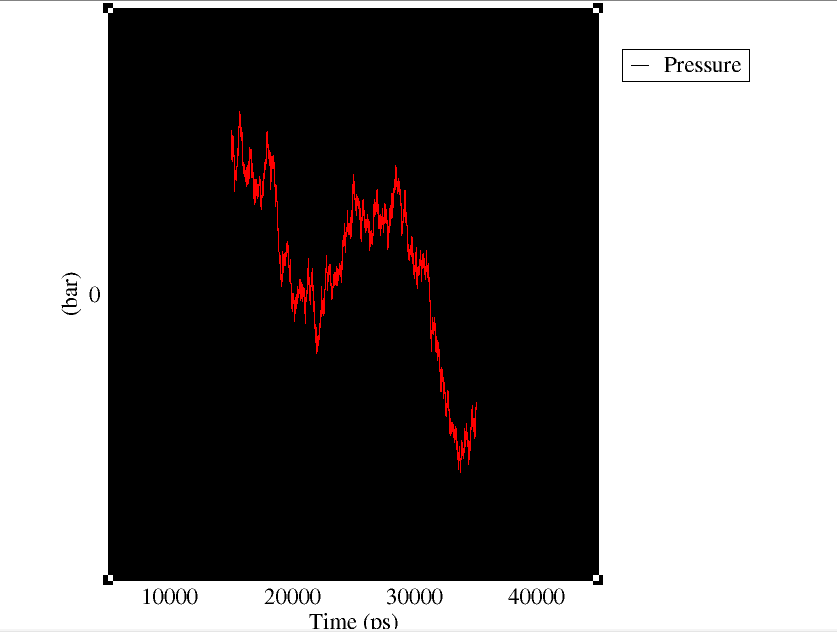
I have removed initial 0 to 4900 ps data and have rescaled the x axis from 5000 ps to 45000 ps taking running average as 10000. Please excuse as I am very much new to gromacs and xmgrace. I present here one image. Let me know if I have to bring more.
Thank you.
The problem is that it is very difficult to say anything about the red line due to the scale of the plot. As I said, you need to hide the first (black) data set and then use the automatic rescale tool in the toolbar.
You can of course also keep the black dataset, but then you need to manually set the scale of the axes. Double click on the y axis and set the range to, e.g., -5 to 5. It might help if you set the scale of the x axis to 10,000 to 40,000 as well.
This is an image I could generate by far (and it looks scary!). I have set y axis from -5 bar to 5 bar and x axis from 5000 ps to 45000 ps. I have also put 10000 in running average section. Please have a look.
So, the difference is still quite small, but the trend definitely seems like the pressure is going down over the course of the simulation. I can’t judge if that’s a problem or not, but if you are very interested in a stable pressure you might want to extend the simulation and discard more data in the beginning.
The problem is that with the large fluctuations in pressure it is difficult to get it to exactly the target value (1 bar), but with a long enough simulation (and discarding drifting data in the beginning) I would expect that you can get the Average (over a “stable” period of time) to 1 bar ± (2 x Err.Est.).
Hi,
What is the coupling pressure time?


