GROMACS version: 2020.6
GROMACS modification: No
Hi,
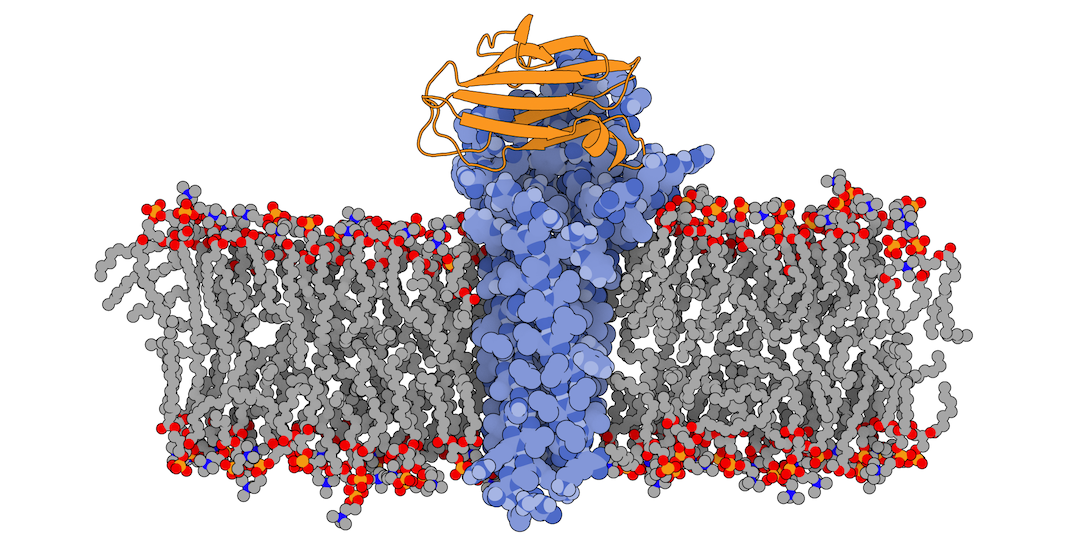
I have run various simulations of a membrane-embedded protein in GROMACS. To aid my analysis, I would like to plot (via either Pymol or VMD) the configuration of the protein in a “sliced” membrane (like this figure: https://lightdock.org/tutorials/0.9.1/membrane/3x29_membrane.png ).
I could not find any easy way to do so; do you have any suggestions on how to do that?
Thank you